Production Agenda
The Production Agenda dashboard is used in Workcube to monitor, manage and analyze production processes. This dashboard contains important data such as work orders by stations, products in progress, number of pauses, products to start production, production quantities by stations and months, missing products.
Path: ERP > Production > Production> Production Agenda
Active Production Orders – By Station
Graph, different production It shows which products are active as work orders at the stations. The total work order rate of each station is indicated in percentages. These ratios allow to analyze the production intensity at the stations.
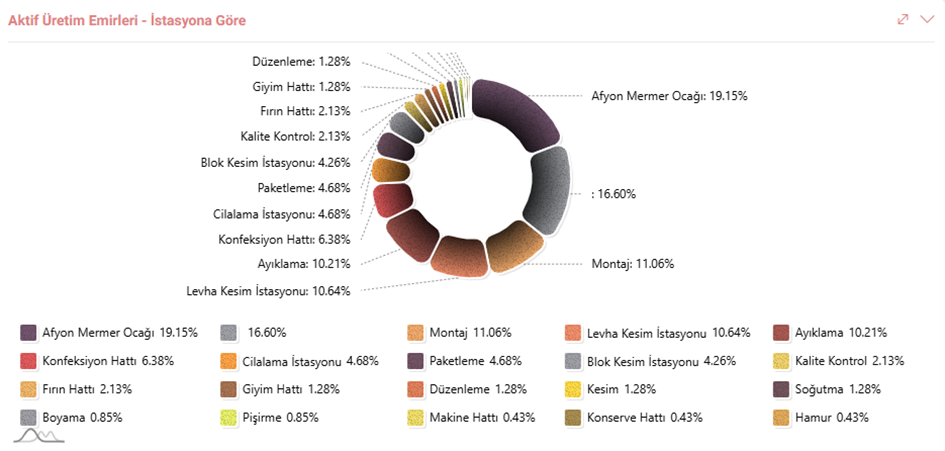
Note: The chart is based on stations that are active and have a remaining amount greater than 0. Production order numbers are listed from largest to smallest and only the first 20 records are shown in the chart.
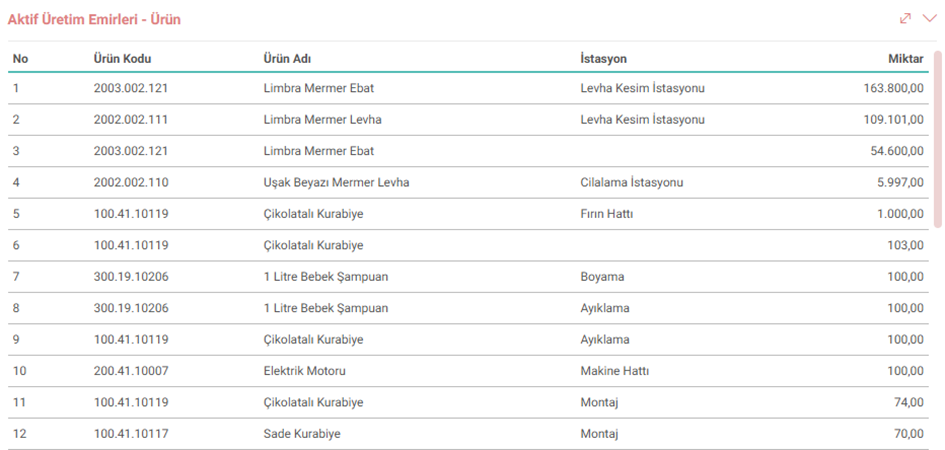
Active Production Orders – Product
This field contains the list of products in progress. It can be monitored which products are processed at which station.
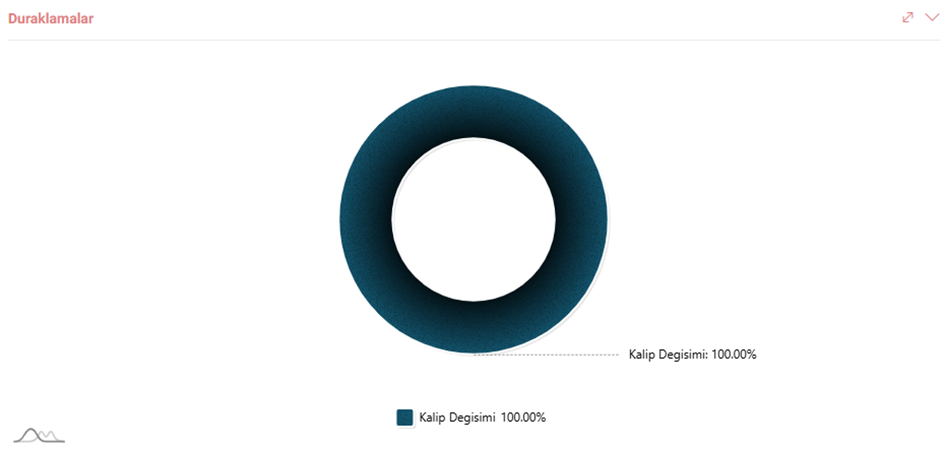
Interruptions
The interruption chart shows the interruptions in the production process as a percentage. Pauses that occur for various reasons (machine malfunction, lack of materials, etc.) are included in this section. This data plays an important role in determining where improvements need to be made on the production line.
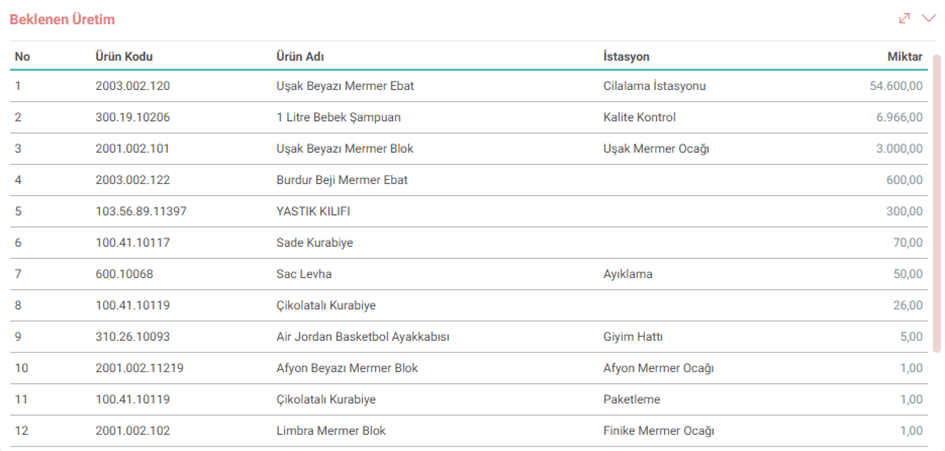
Expected Production
In this panel, work orders that have not yet started production but are waiting in the queue are listed in this area. By viewing the names and quantities of the products, it can be tracked which products will be put into production soon. Thus, possible delays in the production line can be detected and prevented.
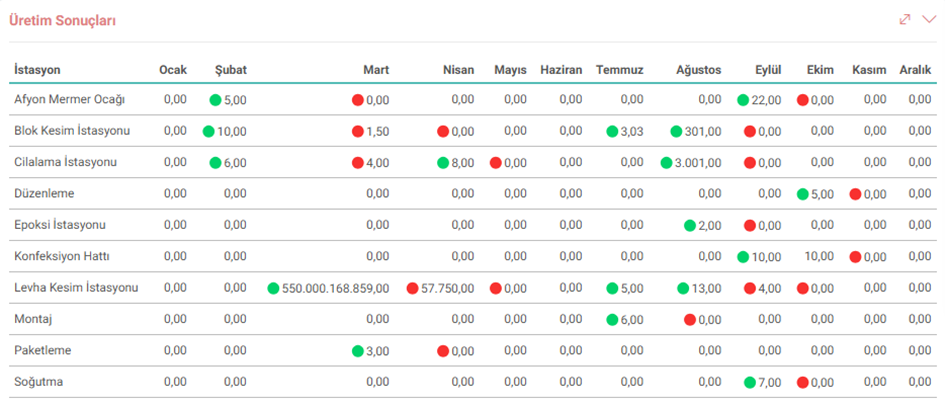
Production Results
The production results table contains the quantities produced monthly at each station. This table allows comparison with monthly production targets and can be used to evaluate the performance of stations.
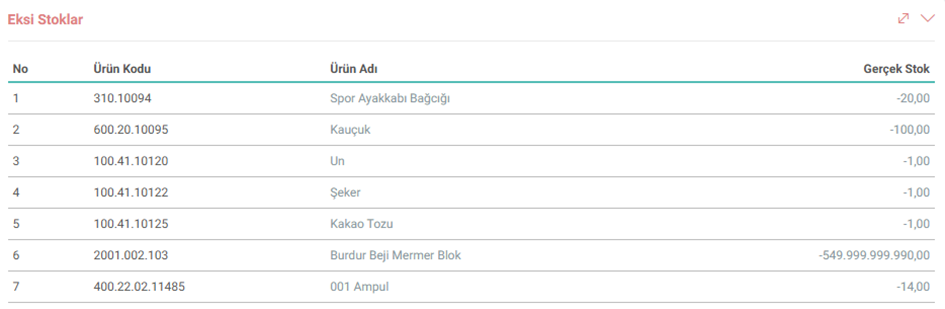
Missing Stocks
The Missing Stocks section shows products that are needed in production but are out of stock or insufficient. This information helps to ensure the necessary stock tracking to prevent disruptions in production planning and to ensure continuity of the production process.
Production Results
This section shows production orders by station in chronological order. It can be observed how many production orders there were for each station on the relevant dates.
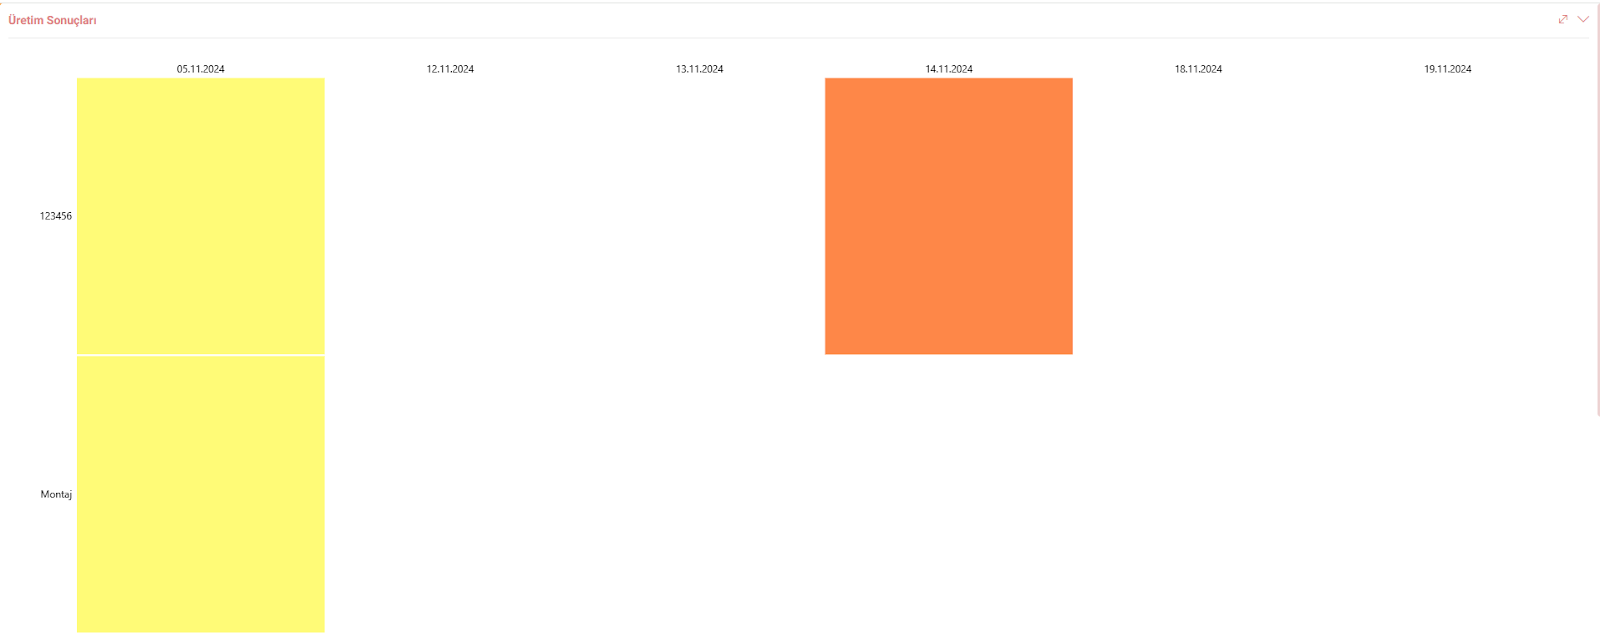
- Yellow: 1 production order
- Orange: 2 production orders
- Red: 3 production orders
Feedback
2.3.1.9. Production Design Reports
With the Production Design module, product questions, pause types, workstations, model product cost and supply plan, operations, production features, trees and trees related to trees are recorded in the system in detail. Detailed analysis of these records is carried out via reporting screens.
2.2.9.4. Internal Demands
Within the organization, your employees can create internal demand for the products and services they need. To create internal demand, click on the “+” icon on the listing screen.
2.3.2.5. Production Orders
Production Orders can be thought of as definitive instructions given to production to produce the relevant material.
Production Dashboard
A new Production Agenda Dashboard has been developed.