-
Project Management Guide
- 1. Project Planning and Preparation 1. Project Planning and Preparation
- 2. Agile and Implementation 2. Agile and Implementation
- 3. Project Team 3. Project Team
- 4. Project Audit 4. Project Audit
- 5. Advice to Project Managers 5. Advice to Project Managers
- Project Survival, Support Services and SLA Project Survival, Support Services and SLA
-
Holistic Philosophy
- Philosophy of Workcube Philosophy of Workcube
- Workcube Manifesto Workcube Manifesto
-
Strategic Framework Guide
- 1. Strategic Framework Study 1. Strategic Framework Study
- 2. Competitive Analysis with the Diamond Model 2. Competitive Analysis with the Diamond Model
- 3. Value Proposition – Value Positioning 3. Value Proposition – Value Positioning
- 4. Digital Transformation Model 4. Digital Transformation Model
- 5. Business Model 5. Business Model
- 6. Organization Canvas 6. Organization Canvas
- 7. Basic Workflow 7. Basic Workflow
- 8. QPIC-RS Matrix 8. QPIC-RS Matrix
- 9. Time-Value Matrix 9. Time-Value Matrix
-
User Guide
- 1. General Usage and Basic Settings 1. General Usage and Basic Settings
- 1.1. Ecosystem and Users 1.1. Ecosystem and Users
- 1.2. Company Definition and Flow Parameters 1.2. Company Definition and Flow Parameters
- 1.3. Documentation and System Numbers 1.3. Documentation and System Numbers
- 1.4. Currency and Exchange Rates 1.4. Currency and Exchange Rates
- 1.5. Authority Groups 1.5. Authority Groups
- 1.5.1. Authorization Types 1.5.1. Authorization Types
- 1.5.1.1. GDPR Authorization 1.5.1.1. GDPR Authorization
- 1.5.2. Branch Office, Warehouse and Location Authorizations 1.5.2. Branch Office, Warehouse and Location Authorizations
- 1.6. Process Management and Workflows 1.6. Process Management and Workflows
- 1.6.1. QPIC - RS (Processes) 1.6.1. QPIC - RS (Processes)
- 1.6.2. Notifications and Approvals 1.6.2. Notifications and Approvals
- 1.6.3. Workflow Designer 1.6.3. Workflow Designer
- 1.7. Transaction Categories 1.7. Transaction Categories
- 1.9. Personalization and Personal Settings 1.9. Personalization and Personal Settings
- 1.10. WOC - Workcube Output Center 1.10. WOC - Workcube Output Center
- 1.10.1. Output Templates 1.10.1. Output Templates
- 1.11. Basket Settings and Usage 1.11. Basket Settings and Usage
- 1.11.1. Person-Account Selection Screens 1.11.1. Person-Account Selection Screens
- 1.12. Workcube Language Sets 1.12. Workcube Language Sets
- 1.13. Login and Active Directory 1.13. Login and Active Directory
- 1.14. Expense Receipts - Basket Columns 1.14. Expense Receipts - Basket Columns
- 1.15. Accounting Period 1.15. Accounting Period
- 1.16. Scheduled Tasks 1.16. Scheduled Tasks
- 1.17. Rounding Settings 1.17. Rounding Settings
- 1.18. System Mails 1.18. System Mails
- 1.19. How Does a Workcube Page Work? 1.19. How Does a Workcube Page Work?
- 1.21. Google Sheets - Workcube Integration 1.21. Google Sheets - Workcube Integration
- 2.1. ERP: Finance-Accounting-Budget 2.1. ERP: Finance-Accounting-Budget
- 2.1.1. Accounting Transactions 2.1.1. Accounting Transactions
- 2.1.1.1. Accounting Chart of Accounts 2.1.1.1. Accounting Chart of Accounts
- 2.1.1.1.1. Chart of Accounts Transfer 2.1.1.1.1. Chart of Accounts Transfer
- 2.1.1.1.2. Chart of Accounts at the Beginning of the Fiscal Year 2.1.1.1.2. Chart of Accounts at the Beginning of the Fiscal Year
- 2.1.1.1.3. Debt Inequality in Accounting Transactions 2.1.1.1.3. Debt Inequality in Accounting Transactions
- 2.1.1.1.4. Accounting Receipts 2.1.1.1.4. Accounting Receipts
- 2.1.1.2. Tax Definitions 2.1.1.2. Tax Definitions
- 2.1.1.4. Accounting Transaction Categories 2.1.1.4. Accounting Transaction Categories
- 2.1.1.5 5. Dimension Transaction 2.1.1.5 5. Dimension Transaction
- 2.1.2. Budget Planning and Control 2.1.2. Budget Planning and Control
- 2.1.2.1. Budget Categories and Budget Items 2.1.2.1. Budget Categories and Budget Items
- 2.1.2.3. Budget Dashboard 2.1.2.3. Budget Dashboard
- 2.1.2.4. Budget Transfer Request 2.1.2.4. Budget Transfer Request
- 2.1.3. Current Account and Transactions 2.1.3. Current Account and Transactions
- 2.1.3.1. Current Account Definitions 2.1.3.1. Current Account Definitions
- 2.1.3.2. Accounts and Contacts Accounting Definitions 2.1.3.2. Accounts and Contacts Accounting Definitions
- 2.1.3.3. Current Transactions 2.1.3.3. Current Transactions
- 2.1.3.4. Current Account Statement 2.1.3.4. Current Account Statement
- 2.1.3.5. Current Account Transfer 2.1.3.5. Current Account Transfer
- 2.1.4. Cash Account 2.1.4. Cash Account
- 2.1.4.1. Cash Account Management 2.1.4.1. Cash Account Management
- 2.1.4.2. Cash Payment 2.1.4.2. Cash Payment
- 2.1.4.3. Cash Flow 2.1.4.3. Cash Flow
- 2.1.4.4. Revenue and Expense Estimations 2.1.4.4. Revenue and Expense Estimations
- 2.1.4.5.1. Collection Forecast Analysis Report 2.1.4.5.1. Collection Forecast Analysis Report
- 2.1.4.7. Payment Receipt 2.1.4.7. Payment Receipt
- 2.1.5. Bank 2.1.5. Bank
- 2.1.5.1. Definition of Bank Transaction Categories 2.1.5.1. Definition of Bank Transaction Categories
- 2.1.5.4. Defining Bank Accounts 2.1.5.4. Defining Bank Accounts
- 2.1.5.5. Bank Account Openings 2.1.5.5. Bank Account Openings
- 2.1.5.8. What is Virtual Pos and How Does It Work? 2.1.5.8. What is Virtual Pos and How Does It Work?
- 2.1.5.8.1. Requirements for Virtual POS and Virtual POS Integration 2.1.5.8.1. Requirements for Virtual POS and Virtual POS Integration
- 2.1.5.9. Credit Cards 2.1.5.9. Credit Cards
- 2.1.5.10. Cash Deposit and Withdrawal 2.1.5.10. Cash Deposit and Withdrawal
- 2.1.5.11. Credit Card Payment/Collection Methods 2.1.5.11. Credit Card Payment/Collection Methods
- 2.1.5.12. Bank Instructions 2.1.5.12. Bank Instructions
- 2.1.5.16. Foreign Exchange Buy/Sale Transaction 2.1.5.16. Foreign Exchange Buy/Sale Transaction
- 2.1.6. Check - Note 2.1.6. Check - Note
- 2.1.6. Stamp Tax Declaration Preparation Report 2.1.6. Stamp Tax Declaration Preparation Report
- 2.1.6.1. Check Transactions 2.1.6.1. Check Transactions
- 2.1.6.1.1. Check Exit Registers 2.1.6.1.1. Check Exit Registers
- 2.1.6.1.2. Check/Note Transaction Categories 2.1.6.1.2. Check/Note Transaction Categories
- 2.1.6.2. Note Transactions 2.1.6.2. Note Transactions
- 2.1.6.2.1. Note Exit Registers 2.1.6.2.1. Note Exit Registers
- 2.1.7. Debt / Receivable Management 2.1.7. Debt / Receivable Management
- 2.1.7.1. Debt/Credit Breakdown 2.1.7.1. Debt/Credit Breakdown
- 2.1.7.2. Exchange Valuation Transactions 2.1.7.2. Exchange Valuation Transactions
- 2.1.7.3. Payment Performance 2.1.7.3. Payment Performance
- 2.1.7.4. Invoice Closing Transactions 2.1.7.4. Invoice Closing Transactions
- 2.1.7.5. Payment Requests 2.1.7.5. Payment Requests
- 2.1.8. Credit 2.1.8. Credit
- 2.1.8.1. Credit and Fund Management Transaction Categories 2.1.8.1. Credit and Fund Management Transaction Categories
- 2.1.8.9. Reconciliation 2.1.8.9. Reconciliation
- 2.1.8.9.10. RN-NS Notification 2.1.8.9.10. RN-NS Notification
- 2.1.9. Risk and Assurance 2.1.9. Risk and Assurance
- 2.1.9.1. Risk and Assurance Definitions 2.1.9.1. Risk and Assurance Definitions
- 2.1.9.4. Execution Proceedings 2.1.9.4. Execution Proceedings
- 2.1.9.6. Collaterals 2.1.9.6. Collaterals
- 2.1.10. Expense And Income Transactions 2.1.10. Expense And Income Transactions
- 2.1.10.1. Expense and Revenue Distribution Templates 2.1.10.1. Expense and Revenue Distribution Templates
- 2.1.10.2. Expense, Revenue and Maintenance Receipts XML Settings 2.1.10.2. Expense, Revenue and Maintenance Receipts XML Settings
- 2.1.11.4. Accounting Ledgers 2.1.11.4. Accounting Ledgers
- 2.1.11.6. Valuation and Rediscount Transaction Categories 2.1.11.6. Valuation and Rediscount Transaction Categories
- 2.1.11.7. Valuation and Rediscount 2.1.11.7. Valuation and Rediscount
- 2.1.11.8. Rediscount Transactions 2.1.11.8. Rediscount Transactions
- 2.1.12. Budget 2.1.12. Budget
- 2.1.12.1. Budget, Expense and Revenue Transaction Categories 2.1.12.1. Budget, Expense and Revenue Transaction Categories
- 2.1.12.2. Budget, Expense, and Revenue Process and Authorization 2.1.12.2. Budget, Expense, and Revenue Process and Authorization
- 2.1.12.3. Budget Planning Receipts 2.1.12.3. Budget Planning Receipts
- 2.1.13. Fixed Assets 2.1.13. Fixed Assets
- 2.1.13.1. Fixed Asset Transaction Categories 2.1.13.1. Fixed Asset Transaction Categories
- 2.1.13.8. Depreciation and Valuation 2.1.13.8. Depreciation and Valuation
- 2.1.14. Cost Accounting 2.1.14. Cost Accounting
- 2.1.15.1. End of Period and Fiscal Year Transition 2.1.15.1. End of Period and Fiscal Year Transition
- 2.1.17. Financial Statements 2.1.17. Financial Statements
- 2.1.17.1. Trial Balance 2.1.17.1. Trial Balance
- 2.1.17.3. Income Table 2.1.17.3. Income Table
- 2.1.18.1. What is Magic Accounter and How Can You Use It? 2.1.18.1. What is Magic Accounter and How Can You Use It?
- 2.1.18.2. What is Magic Auditor and How Can You Use It? 2.1.18.2. What is Magic Auditor and How Can You Use It?
- 2.1.18.3. What is Magic Budgeter? How to Use? 2.1.18.3. What is Magic Budgeter? How to Use?
- 2.1.19. Securities 2.1.19. Securities
- 2.1.20. e-Government 2.1.20. e-Government
- 2.1.20.1. e-Government Dashboard 2.1.20.1. e-Government Dashboard
- 2.1.20.2. What is e-Ledger? 2.1.20.2. What is e-Ledger?
- 2.1.20.3. What is e-Invoice? 2.1.20.3. What is e-Invoice?
- 2.1.20.3.1. E-Invoice Integration and Parametric Definitions 2.1.20.3.1. E-Invoice Integration and Parametric Definitions
- 2.1.20.3.2. Sending E-Invoice 2.1.20.3.2. Sending E-Invoice
- 2.1.20.3.3. Public e-Invoice 2.1.20.3.3. Public e-Invoice
- 2.1.20.3.4. Export e-Invoice 2.1.20.3.4. Export e-Invoice
- 2.1.20.4. What is e-Archive? 2.1.20.4. What is e-Archive?
- 2.1.20.4.1. E-Archive Integration and Parametric Definitions 2.1.20.4.1. E-Archive Integration and Parametric Definitions
- 2.1.20.4.2. E-Archive Submission 2.1.20.4.2. E-Archive Submission
- 2.1.20.5. What is e-Delivery Note? 2.1.20.5. What is e-Delivery Note?
- 2.1.21. Integration Between Accountant and Taxpayer 2.1.21. Integration Between Accountant and Taxpayer
- 2.2. Workcube SD / Sales Distribution 2.2. Workcube SD / Sales Distribution
- 2.2.1. Customer-Supplier Management 2.2.1. Customer-Supplier Management
- 2.2.1.1. Customer-Supplier Parametric Definitions 2.2.1.1. Customer-Supplier Parametric Definitions
- 2.2.1.2. Customer-Supplier Process Definitions and Transaction Categories 2.2.1.2. Customer-Supplier Process Definitions and Transaction Categories
- 2.2.1.3. Customers and Suppliers XML Settings 2.2.1.3. Customers and Suppliers XML Settings
- 2.2.1.4. Accounts 2.2.1.4. Accounts
- 2.2.1.4.1. Account Contacts 2.2.1.4.1. Account Contacts
- 2.2.1.4.2. Account Branch Offices 2.2.1.4.2. Account Branch Offices
- 2.2.1.5. Contacts 2.2.1.5. Contacts
- 2.2.1.6. Customer-Supplier Branch Office Relationship 2.2.1.6. Customer-Supplier Branch Office Relationship
- 2.2.1.7. BSC 2.2.1.7. BSC
- 2.2.1.8. Customer-Supplier Accounting Periods 2.2.1.8. Customer-Supplier Accounting Periods
- 2.2.1.9. Customer-Supplier Member Information 2.2.1.9. Customer-Supplier Member Information
- 2.2.2.1. Product Management 2.2.2.1. Product Management
- 2.2.2.1.1. Product Parametric Definitions 2.2.2.1.1. Product Parametric Definitions
- 2.2.2.1.2. Product Process Definitions 2.2.2.1.2. Product Process Definitions
- 2.2.2.1.3. Product XML Settings 2.2.2.1.3. Product XML Settings
- 2.2.2.1.4. Product Category Management 2.2.2.1.4. Product Category Management
- 2.2.2.1.5. Product Configurations 2.2.2.1.5. Product Configurations
- 2.2.2.1.6. Product Feature Definitions and Variation Management 2.2.2.1.6. Product Feature Definitions and Variation Management
- 2.2.2.1.6.1. Measurement and Allocation Table 2.2.2.1.6.1. Measurement and Allocation Table
- 2.2.2.1.7. Product Accounting Account Definitions 2.2.2.1.7. Product Accounting Account Definitions
- 2.2.2.1.9. Basic Product Definitions 2.2.2.1.9. Basic Product Definitions
- 2.2.2.1.10. Product Price Detail 2.2.2.1.10. Product Price Detail
- 2.2.2.1.11. Pricing the Product, Entering Conditions, Inventory Status 2.2.2.1.11. Pricing the Product, Entering Conditions, Inventory Status
- 2.2.2.1.12. Product Detail and Product General Parameters 2.2.2.1.12. Product Detail and Product General Parameters
- 2.2.2.1.13. Mixed Parcel 2.2.2.1.13. Mixed Parcel
- 2.2.2.1.14. Product-Inventory Selection Lists 2.2.2.1.14. Product-Inventory Selection Lists
- 2.2.2.1.15. Serial Number and Lot Tracking 2.2.2.1.15. Serial Number and Lot Tracking
- 2.2.2.1.16. Print Batch Barcode 2.2.2.1.16. Print Batch Barcode
- 2.2.2.1.17. Product Purchase-Sale Conditions 2.2.2.1.17. Product Purchase-Sale Conditions
- 2.2.2.1.18. Product Quality Control Definitions 2.2.2.1.18. Product Quality Control Definitions
- 2.2.2.1.19. Model Product 2.2.2.1.19. Model Product
- 2.2.2.1.19.1. Model-Product Cost and Supply Plan 2.2.2.1.19.1. Model-Product Cost and Supply Plan
- 2.2.2.1.20. Label 2.2.2.1.20. Label
- 2.2.2.2. Competition Management 2.2.2.2. Competition Management
- 2.2.2.3. Inventory Management 2.2.2.3. Inventory Management
- 2.2.2.3.1. Inventories XML Settings 2.2.2.3.1. Inventories XML Settings
- 2.2.2.3.2. Inventory Detail 2.2.2.3.2. Inventory Detail
- 2.2.2.3.3. Fundamentals of Inventory Management 2.2.2.3.3. Fundamentals of Inventory Management
- 2.2.2.3.4. Inventory Strategies 2.2.2.3.4. Inventory Strategies
- 2.2.2.3.5. Zero Inventory Working Principles 2.2.2.3.5. Zero Inventory Working Principles
- 2.2.2.3.6. Inventory-Spec Transactions 2.2.2.3.6. Inventory-Spec Transactions
- 2.2.2.6. e-Delivery Note 2.2.2.6. e-Delivery Note
- 2.2.3. Price Management 2.2.3. Price Management
- 2.2.3.1. Price Lists 2.2.3.1. Price Lists
- 2.2.3.2. Price Editing and Transfer 2.2.3.2. Price Editing and Transfer
- 2.2.3.3. Price Recommendations 2.2.3.3. Price Recommendations
- 2.2.3.4. Special Prices and Discounts 2.2.3.4. Special Prices and Discounts
- 2.2.4. Cost 2.2.4. Cost
- 2.2.4.1. Cost Parametric Definitions 2.2.4.1. Cost Parametric Definitions
- 2.2.4.2. Product Costs 2.2.4.2. Product Costs
- 2.2.4.2.1. Product Cost in Workcube 2.2.4.2.1. Product Cost in Workcube
- 2.2.4.3. Inventory Costs 2.2.4.3. Inventory Costs
- 2.2.4.4. Product Cost and Profit Margins 2.2.4.4. Product Cost and Profit Margins
- 2.2.4.5. Distribution of Consumables and Material Loss Receipts to Expense Centers 2.2.4.5. Distribution of Consumables and Material Loss Receipts to Expense Centers
- 2.2.4.6. Production Estimated Cost 2.2.4.6. Production Estimated Cost
- 2.2.4.7. Re-Cost 2.2.4.7. Re-Cost
- 2.2.5.1. Agreements 2.2.5.1. Agreements
- 2.2.5.3. Price Difference and Bonus Controls 2.2.5.3. Price Difference and Bonus Controls
- 2.2.6. Warehouse and Space Management 2.2.6. Warehouse and Space Management
- 2.2.7. Shipment - Logistics Management 2.2.7. Shipment - Logistics Management
- 2.2.7.1. Shipment - Logistics Parametric Definitions 2.2.7.1. Shipment - Logistics Parametric Definitions
- 2.2.7.2. Shipment-Logistics Processes and Transaction Categories 2.2.7.2. Shipment-Logistics Processes and Transaction Categories
- 2.2.7.3. Inventory Transactions 2.2.7.3. Inventory Transactions
- 2.2.7.4. Shipment-Logistics Orders 2.2.7.4. Shipment-Logistics Orders
- 2.2.7.5. Purchase Delivery Notes 2.2.7.5. Purchase Delivery Notes
- 2.2.7.6. Sales Delivery Notes 2.2.7.6. Sales Delivery Notes
- 2.2.7.7. Inter-Warehouse Transfer Delivery Note 2.2.7.7. Inter-Warehouse Transfer Delivery Note
- 2.2.7.8. Shipping Request 2.2.7.8. Shipping Request
- 2.2.7.9. Inventory Receipts 2.2.7.9. Inventory Receipts
- 2.2.7.10. Inventory Opening (Carryforward) Receipt 2.2.7.10. Inventory Opening (Carryforward) Receipt
- 2.2.7.11. Inventory Transfer 2.2.7.11. Inventory Transfer
- 2.2.7.12. Spec Transfer 2.2.7.12. Spec Transfer
- 2.2.7.13. Stock-taking Transactions 2.2.7.13. Stock-taking Transactions
- 2.2.7.14. In-Group Transactions 2.2.7.14. In-Group Transactions
- 2.2.7.16. Delivery Note - Order Relation and Shipment Methods of Orders 2.2.7.16. Delivery Note - Order Relation and Shipment Methods of Orders
- 2.2.7.17. Inventory Carryforward Slip and Inventory Age Calculation 2.2.7.17. Inventory Carryforward Slip and Inventory Age Calculation
- 2.2.7.18. Serial Number Warranty Tracking on Delivery Note 2.2.7.18. Serial Number Warranty Tracking on Delivery Note
- 2.2.7.19. Packaging and Shipments 2.2.7.19. Packaging and Shipments
- 2.2.7.19.1. Packages 2.2.7.19.1. Packages
- 2.2.7.20. Shipment - Logistics | Map 2.2.7.20. Shipment - Logistics | Map
- 2.2.7.21. Team Planning 2.2.7.21. Team Planning
- 2.2.7.22. Returns 2.2.7.22. Returns
- 2.2.7.23. Consignment Transactions 2.2.7.23. Consignment Transactions
- 2.2.7.24. Batch Shipment Planning 2.2.7.24. Batch Shipment Planning
- 2.2.8. Sales Management 2.2.8. Sales Management
- 2.2.8.1. Sales Management Parametric Definitions 2.2.8.1. Sales Management Parametric Definitions
- 2.2.8.2. Sales Management XML Settings 2.2.8.2. Sales Management XML Settings
- 2.2.8.3. Sales Management Process Definitions 2.2.8.3. Sales Management Process Definitions
- 2.2.8.4. Sales Proposals 2.2.8.4. Sales Proposals
- 2.2.8.5. Sales Orders 2.2.8.5. Sales Orders
- 2.2.8.6. Installments Sales 2.2.8.6. Installments Sales
- 2.2.8.7. Sales Map 2.2.8.7. Sales Map
- 2.2.9. Purchasing Management 2.2.9. Purchasing Management
- 2.2.9.1. Purchasing Parametric Definitions 2.2.9.1. Purchasing Parametric Definitions
- 2.2.9.2. Purchasing XML Settings 2.2.9.2. Purchasing XML Settings
- 2.2.9.3. Purchasing Processes and Transaction Categories 2.2.9.3. Purchasing Processes and Transaction Categories
- 2.2.9.4. Internal Requests 2.2.9.4. Internal Requests
- 2.2.9.5. Internal Request Listing 2.2.9.5. Internal Request Listing
- 2.2.9.6. Purchase Request 2.2.9.6. Purchase Request
- 2.2.9.7. Purchase Offers 2.2.9.7. Purchase Offers
- 2.2.9.7.1. Purchase Offer Evaluations and Received Offer Acceptance 2.2.9.7.1. Purchase Offer Evaluations and Received Offer Acceptance
- 2.2.9.8. Purchase Orders 2.2.9.8. Purchase Orders
- 2.2.9.9. Place Batch Order 2.2.9.9. Place Batch Order
- 2.2.11.1. Invoice Parametric Definitions 2.2.11.1. Invoice Parametric Definitions
- 2.2.11.2. Invoice Processes and Transaction Categories 2.2.11.2. Invoice Processes and Transaction Categories
- 2.2.11.3. Invoice Issue Orders 2.2.11.3. Invoice Issue Orders
- 2.2.11.4. Sales Invoice 2.2.11.4. Sales Invoice
- 2.2.11.4.1. Issued Service Invoice 2.2.11.4.1. Issued Service Invoice
- 2.2.11.4.2. Issued Proforma Invoice 2.2.11.4.2. Issued Proforma Invoice
- 2.2.11.4.3. Issued Progress Payment Invoice 2.2.11.4.3. Issued Progress Payment Invoice
- 2.2.11.4.5. Issued Exchange Rate Difference Invoice 2.2.11.4.5. Issued Exchange Rate Difference Invoice
- 2.2.11.4.6. VAT Exempt Sales Invoice 2.2.11.4.6. VAT Exempt Sales Invoice
- 2.2.11.4.7. Purchase Return Invoice 2.2.11.4.7. Purchase Return Invoice
- 2.2.11.4.8. Issued Delay Interest Invoice 2.2.11.4.8. Issued Delay Interest Invoice
- 2.2.11.4.9. Export Invoice 2.2.11.4.9. Export Invoice
- 2.2.11.4.10. Unpaid Non-Quota Export Invoice 2.2.11.4.10. Unpaid Non-Quota Export Invoice
- 2.2.11.4.12. Invoices Including Withholding 2.2.11.4.12. Invoices Including Withholding
- 2.2.11.5. Purchase Invoice 2.2.11.5. Purchase Invoice
- 2.2.11.5.1. Goods Purchase Invoice 2.2.11.5.1. Goods Purchase Invoice
- 2.2.11.5.3. Received Progress Payment Invoice 2.2.11.5.3. Received Progress Payment Invoice
- 2.2.11.5.4. Received Services Invoice 2.2.11.5.4. Received Services Invoice
- 2.2.11.5.5. Received Proforma Invoice 2.2.11.5.5. Received Proforma Invoice
- 2.2.11.5.6. Received Exchange Rate Difference Invoice 2.2.11.5.6. Received Exchange Rate Difference Invoice
- 2.2.11.5.7. Received Delay Interest Invoice 2.2.11.5.7. Received Delay Interest Invoice
- 2.2.11.5.8. Note of Expenses - Services 2.2.11.5.8. Note of Expenses - Services
- 2.2.11.5.9. Note of Expense - Goods 2.2.11.5.9. Note of Expense - Goods
- 2.2.11.5.11. Import Invoice 2.2.11.5.11. Import Invoice
- 2.2.11.5.12. Self-Employed Invoice 2.2.11.5.12. Self-Employed Invoice
- 2.2.11.5.13. Retail Sales Return Invoice 2.2.11.5.13. Retail Sales Return Invoice
- 2.2.11.5.14. Wholesale Return Invoice 2.2.11.5.14. Wholesale Return Invoice
- 2.2.11.5.15. Retail Sales Invoice 2.2.11.5.15. Retail Sales Invoice
- 2.2.11.6. Difference Invoice in Health Expenditures 2.2.11.6. Difference Invoice in Health Expenditures
- 2.2.12.4. Imported Goods Entry 2.2.12.4. Imported Goods Entry
- 2.2.12.5. Import Transactions 2.2.12.5. Import Transactions
- 2.2.14. Promotion Management 2.2.14. Promotion Management
- 2.2.14.1. Promotions 2.2.14.1. Promotions
- 2.2.14.3. TPD (Trade Promotions and Discounts) 2.2.14.3. TPD (Trade Promotions and Discounts)
- 2.2.14.4. Active Promotions 2.2.14.4. Active Promotions
- 2.2.14.5. Shopping Coupons 2.2.14.5. Shopping Coupons
- 2.3. MM - Production 2.3. MM - Production
- 2.3.1. Production Design 2.3.1. Production Design
- 2.3.1.1. Production Design Parametric Definitions 2.3.1.1. Production Design Parametric Definitions
- 2.3.1.2. Production Design Page Settings (XML) Settings 2.3.1.2. Production Design Page Settings (XML) Settings
- 2.3.1.3. Production Design Processes and Transaction Categories 2.3.1.3. Production Design Processes and Transaction Categories
- 2.3.1.4. BOM Design 2.3.1.4. BOM Design
- 2.3.1.4.2. CLO3D Workcube Integration 2.3.1.4.2. CLO3D Workcube Integration
- 2.3.1.5. Production Work Centers and Operations 2.3.1.5. Production Work Centers and Operations
- 2.3.1.6. BOMs Revision Management 2.3.1.6. BOMs Revision Management
- 2.3.1.7. Alternative Raw Material Management 2.3.1.7. Alternative Raw Material Management
- 2.3.1.8. Spec Management with Alternative Product Questions 2.3.1.8. Spec Management with Alternative Product Questions
- 2.3.1.8.1. Alternative Product Variation Product Structure (BOM) 2.3.1.8.1. Alternative Product Variation Product Structure (BOM)
- 2.3.2. Production Planning 2.3.2. Production Planning
- 2.3.2.1. Production Planning Page Settings (XML) Settings 2.3.2.1. Production Planning Page Settings (XML) Settings
- 2.3.2.2. Production Planning Processes and Transaction Categories 2.3.2.2. Production Planning Processes and Transaction Categories
- 2.3.2.3. Production Requests 2.3.2.3. Production Requests
- 2.3.2.4. Production - Orders 2.3.2.4. Production - Orders
- 2.3.2.5. Production Orders 2.3.2.5. Production Orders
- 2.3.2.5.1. Grouping Function 2.3.2.5.1. Grouping Function
- 2.3.2.7. Production Results 2.3.2.7. Production Results
- 2.3.2.8. In Production 2.3.2.8. In Production
- 2.3.2.9. Material Requirements 2.3.2.9. Material Requirements
- 2.3.2.10. Chart 2.3.2.10. Chart
- 2.3.2.11. Production Operations List 2.3.2.11. Production Operations List
- 2.3.3. Production 2.3.3. Production
- 2.3.3.1. Production Page Settings (XML) Settings 2.3.3.1. Production Page Settings (XML) Settings
- 2.3.3.2. Production Transactions 2.3.3.2. Production Transactions
- 2.3.3.2.1. Serial Number in Production Processes 2.3.3.2.1. Serial Number in Production Processes
- 2.4. Quality Control Processes 2.4. Quality Control Processes
- 2.4.1. Laboratory Operations 2.4.1. Laboratory Operations
- 2.4.2. Quality Control Grouping 2.4.2. Quality Control Grouping
- 3. Workcube HR / Human Resources 3. Workcube HR / Human Resources
- 3.1. Organization Planning 3.1. Organization Planning
- 3.1.3.1. Google Maps - Branch Offices 3.1.3.1. Google Maps - Branch Offices
- 3.1.7. Top Level Units 3.1.7. Top Level Units
- 3.1.8. Organizational Chart 3.1.8. Organizational Chart
- 3.1.9. Charts 3.1.9. Charts
- 3.3. Human Resources Operations 3.3. Human Resources Operations
- 3.3.1. Human Resources Recruitment and Selection 3.3.1. Human Resources Recruitment and Selection
- 3.3.1.9. Orientation Training 3.3.1.9. Orientation Training
- 3.3.2. Human Resources Employee Recruitment 3.3.2. Human Resources Employee Recruitment
- 3.3.2.1. Trial Process Forms 3.3.2.1. Trial Process Forms
- 3.3.2.2. Human Resources Officer Recruitment and Payroll 3.3.2.2. Human Resources Officer Recruitment and Payroll
- 3.3.2.3. Defining Human Resources Additional Allowance 3.3.2.3. Defining Human Resources Additional Allowance
- 3.3.3. Payroll Rules 3.3.3. Payroll Rules
- 3.3.3.3. Wage Rules 3.3.3.3. Wage Rules
- 3.3.5. Timekeeping Transactions 3.3.5. Timekeeping Transactions
- 3.3.5.1. Mail Sending in Timekeeping 3.3.5.1. Mail Sending in Timekeeping
- 3.3.5.3. Additional Allowance Definitions 3.3.5.3. Additional Allowance Definitions
- 3.3.5.4. Timekeeping Sequential Transactions 3.3.5.4. Timekeeping Sequential Transactions
- 3.3.5.5. Payrolling 3.3.5.5. Payrolling
- 3.3.5.6. Accounting and Budgeting of Timekeeping 3.3.5.6. Accounting and Budgeting of Timekeeping
- 3.3.5.7. Dynamic Payroll 3.3.5.7. Dynamic Payroll
- 3.3.5.8. Salary Payments 3.3.5.8. Salary Payments
- 3.3.5.9. Execution Applications 3.3.5.9. Execution Applications
- 3.3.5.9.1. Deduction Application from Fixed Amount in Execution 3.3.5.9.1. Deduction Application from Fixed Amount in Execution
- 3.3.5.10. Tax Statement/Declaration 3.3.5.10. Tax Statement/Declaration
- 3.3.5.11. Viewing Tax Statement/Declaration Files 3.3.5.11. Viewing Tax Statement/Declaration Files
- 3.3.5.12. Advance Request 3.3.5.12. Advance Request
- 3.3.5.15. Leaves and Seniority Information Transactions 3.3.5.15. Leaves and Seniority Information Transactions
- 3.3.6. Attendance and Control 3.3.6. Attendance and Control
- 3.3.6.1. List of EATS 3.3.6.1. List of EATS
- 3.3.6.2. Branch Office Based EATS 3.3.6.2. Branch Office Based EATS
- 3.3.6.3. Shifts 3.3.6.3. Shifts
- 3.3.6.4. EATS Status 3.3.6.4. EATS Status
- 3.3.6.5. Subcontractor EATS List 3.3.6.5. Subcontractor EATS List
- 3.3.6.6. Attendance and Control Definitions 3.3.6.6. Attendance and Control Definitions
- 3.3.6.7. Import EATS Transactions 3.3.6.7. Import EATS Transactions
- 3.3.7. Work Schedule and Shift Management 3.3.7. Work Schedule and Shift Management
- 3.3.8. Use of Leave or Free Time for Overtime 3.3.8. Use of Leave or Free Time for Overtime
- 3.3.9. Short Work Allowance 3.3.9. Short Work Allowance
- 3.3.10. Individual Pension System - Automation 3.3.10. Individual Pension System - Automation
- 3.3.10. Travel Allowance 3.3.10. Travel Allowance
- 3.3.11. Import EATS Rules 3.3.11. Import EATS Rules
- 3.3.12. Workcube Message Management System 3.3.12. Workcube Message Management System
- 3.4.1. Workplace Audit Procedures 3.4.1. Workplace Audit Procedures
- 3.4.1.2. Health Expenditure Receipts 3.4.1.2. Health Expenditure Receipts
- 3.5. Work Accidents 3.5. Work Accidents
- 3.6. Health Assurance System 3.6. Health Assurance System
- 3.6.1. Health Expenses, Payroll and Accounting 3.6.1. Health Expenses, Payroll and Accounting
- 3.7. Role Planning 3.7. Role Planning
- 3.7.1. Roles-Positions 3.7.1. Roles-Positions
- 3.7.1.1. Position Types and Definitions 3.7.1.1. Position Types and Definitions
- 3.7.1.2. How to Update Roles-Positions? 3.7.1.2. How to Update Roles-Positions?
- 3.7.1.3. How to List Roles-Positions? 3.7.1.3. How to List Roles-Positions?
- 3.7.2. Transferring Position Task 3.7.2. Transferring Position Task
- 3.7.3. Mass Position Change 3.7.3. Mass Position Change
- 3.7.4. Supervisors and Backups 3.7.4. Supervisors and Backups
- 3.7.5. Promotion and Rotation Requests 3.7.5. Promotion and Rotation Requests
- 3.7.6. Job Definitions 3.7.6. Job Definitions
- 3.7.7. Permanent Staff 3.7.7. Permanent Staff
- 3.7.8. Permanent Staff Vacancies/Excess 3.7.8. Permanent Staff Vacancies/Excess
- 3.7.8.1. Organization Simulator 3.7.8.1. Organization Simulator
- 3.7.9. Competency Definitions 3.7.9. Competency Definitions
- 3.7.10. Mandates 3.7.10. Mandates
- 3.7.11. Employees Eligible for Qualifications 3.7.11. Employees Eligible for Qualifications
- 3.7.12. Designation Promotional Forms 3.7.12. Designation Promotional Forms
- 3.8. Performance Management 3.8. Performance Management
- 3.8.1. Assessment and Evaluation Forms 3.8.1. Assessment and Evaluation Forms
- 3.8.2. Performance Management Parametric Definitions 3.8.2. Performance Management Parametric Definitions
- 3.9. Disciplinary and Other Actions 3.9. Disciplinary and Other Actions
- 3.9.1. Event Report 3.9.1. Event Report
- 4. CRM-Customer Relationship Management 4. CRM-Customer Relationship Management
- 4.1. Customer/Contact Management 4.1. Customer/Contact Management
- 4.2. Sales and Marketing 4.2. Sales and Marketing
- 4.2.1. Sales Force Management 4.2.1. Sales Force Management
- 4.2.1.1. Regional Planning and Sales Teams 4.2.1.1. Regional Planning and Sales Teams
- 4.2.1.2. Target and Quotas 4.2.1.2. Target and Quotas
- 4.2.2.1. Interactions 4.2.2.1. Interactions
- 4.2.2.2. Customer Visits and Meetings 4.2.2.2. Customer Visits and Meetings
- 4.2.2.3. Opportunities 4.2.2.3. Opportunities
- 4.2.2.3.1. Opportunity Management Parametric Definitions 4.2.2.3.1. Opportunity Management Parametric Definitions
- 4.2.3. Marketing 4.2.3. Marketing
- 4.2.3.1. Campaign Management 4.2.3.1. Campaign Management
- 4.2.3.2. Events 4.2.3.2. Events
- 4.2.3.3. Target Group 4.2.3.3. Target Group
- 4.2.3.4. Account Analysis Forms 4.2.3.4. Account Analysis Forms
- 4.2.3.5. Survey Management 4.2.3.5. Survey Management
- 4.2.3.6. Posts and Mailing Lists 4.2.3.6. Posts and Mailing Lists
- 4.2.3.7. SendGrid Mail Integration 4.2.3.7. SendGrid Mail Integration
- 4.3. Service-Warranty Management 4.3. Service-Warranty Management
- 4.3.1. Call Center 4.3.1. Call Center
- 4.3.1.1. Call Center Parametric Definitions 4.3.1.1. Call Center Parametric Definitions
- 4.3.1.2. Call Center Page Settings 4.3.1.2. Call Center Page Settings
- 4.3.1.3. Search Contact 4.3.1.3. Search Contact
- 4.3.1.4. Call Center Applications 4.3.1.4. Call Center Applications
- 4.3.1.6. Phone - Call Center 4.3.1.6. Phone - Call Center
- 4.3.2. Service Management 4.3.2. Service Management
- 4.3.2.1. Service-Warranty Parametric Definitions 4.3.2.1. Service-Warranty Parametric Definitions
- 4.3.2.1.1. Service Applications 4.3.2.1.1. Service Applications
- 4.3.2.1.2. Service Operations 4.3.2.1.2. Service Operations
- 4.3.2.1.3. Service Maintenance Results 4.3.2.1.3. Service Maintenance Results
- 4.3.2.1.4. Maintenance Plans 4.3.2.1.4. Maintenance Plans
- 4.3.2.1.5. Warranty and Product Tracking 4.3.2.1.5. Warranty and Product Tracking
- 4.3.2.1.6. Service Work Groups 4.3.2.1.6. Service Work Groups
- 4.3.2.2 Service Management XML Settings 4.3.2.2 Service Management XML Settings
- 5. Subscription Management 5. Subscription Management
- 5.1. Subscription Parametric Definitions 5.1. Subscription Parametric Definitions
- 5.2. Subscription Page Settings 5.2. Subscription Page Settings
- 5.3. Subscription Authorization and Processes 5.3. Subscription Authorization and Processes
- 5.4. Subscription Registration and Contract 5.4. Subscription Registration and Contract
- 5.5. Subscription Service and Pricing (Payment Plan) 5.5. Subscription Service and Pricing (Payment Plan)
- 5.5.1. Subscription Committed Campaign Management 5.5.1. Subscription Committed Campaign Management
- 5.6. Invoicing Transactions 5.6. Invoicing Transactions
- 5.7. Collection and Taking Automatic Payment 5.7. Collection and Taking Automatic Payment
- 5.8. Counter Transactions 5.8. Counter Transactions
- 5.9. Tariffs 5.9. Tariffs
- 6. PAM - Physical Asset Management 6. PAM - Physical Asset Management
- 6.1. Physical Assets 6.1. Physical Assets
- 6.1.1. Machinery-Equipments and Buildings 6.1.1. Machinery-Equipments and Buildings
- 6.1.2. IT Assets 6.1.2. IT Assets
- 6.1.3. Physical Asset Debit Processes 6.1.3. Physical Asset Debit Processes
- 6.1.4. Shared Use 6.1.4. Shared Use
- 6.1.5. Physical Assets Parametric Definitions 6.1.5. Physical Assets Parametric Definitions
- 6.2. Motor Vehicle Management 6.2. Motor Vehicle Management
- 6.2.1. Motor Vehicles 6.2.1. Motor Vehicles
- 6.2.1.1. Motor Vehicles Parametric Definitions 6.2.1.1. Motor Vehicles Parametric Definitions
- 6.2.1.2. Asset Demands 6.2.1.2. Asset Demands
- 6.2.2. Vehicle Purchase-Sales 6.2.2. Vehicle Purchase-Sales
- 6.2.3. KM Control Management 6.2.3. KM Control Management
- 6.2.4. Fuel Control Management 6.2.4. Fuel Control Management
- 6.2.5. Accident-Penalty Management 6.2.5. Accident-Penalty Management
- 6.3. Repair-Maintenance Management 6.3. Repair-Maintenance Management
- 6.3.1. Failure Notifications 6.3.1. Failure Notifications
- 6.3.2. Repair-Maintenance Plan and Results 6.3.2. Repair-Maintenance Plan and Results
- 6.3.3. Repair-Maintenance Schedule 6.3.3. Repair-Maintenance Schedule
- 6.3.4. Repair-Maintenance Receipts 6.3.4. Repair-Maintenance Receipts
- 7. PMS - Project Management 7. PMS - Project Management
- 7.1.1. Project Requirements and Material Plans 7.1.1. Project Requirements and Material Plans
- 7.1.2. Operations Under the Project 7.1.2. Operations Under the Project
- 7.1.3. Projects XML Settings 7.1.3. Projects XML Settings
- 7.1.4. Project Management Parametric Definitions 7.1.4. Project Management Parametric Definitions
- 7.1.5. Project Management Processes 7.1.5. Project Management Processes
- 7.2.1. Related Tasks 7.2.1. Related Tasks
- 7.3. Project Dashboard 7.3. Project Dashboard
- 7.4. Workboard 7.4. Workboard
- 7.5. Google Drive - Workcube Integration 7.5. Google Drive - Workcube Integration
- 7.6. Time Management 7.6. Time Management
- 9. LMS Training Management 9. LMS Training Management
- 9.1. Lesson 9.1. Lesson
- 9.2. Training Management Parametric Definitions 9.2. Training Management Parametric Definitions
- 10. Intranet 10. Intranet
- 10.1. Intranet Transactions 10.1. Intranet Transactions
- 10.2. Google Calendar - Workcube Integration 10.2. Google Calendar - Workcube Integration
- 10.4. Literature 10.4. Literature
- 10.5. Digital Archive 10.5. Digital Archive
- 10.6. Self-Service HR Transactions 10.6. Self-Service HR Transactions
- 10.7. Self Service Other Processes 10.7. Self Service Other Processes
- 10.8. Library 10.8. Library
- 10.9. Web Phone Usage 10.9. Web Phone Usage
- 10.10. ChatFlow 10.10. ChatFlow
- 10.11. Forum 10.11. Forum
- 10.12. Calendar 10.12. Calendar
- 11.3. Career Portal with Protein 11.3. Career Portal with Protein
- 11.4. Creating a Website with Protein 11.4. Creating a Website with Protein
- 11.5. Creating Pages for Protein Sites 11.5. Creating Pages for Protein Sites
- 11.6. The Concept and Use of Widget in Protein 11.6. The Concept and Use of Widget in Protein
- 11.7. Concept and Use of Design Block in Protein 11.7. Concept and Use of Design Block in Protein
- 12. Workcube Whops 12. Workcube Whops
- 12.1. WHOPS Dashboard 12.1. WHOPS Dashboard
- 13.1. Content Management 13.1. Content Management
- 13.1.1. Contents 13.1.1. Contents
- 13.1.2. Banner Management 13.1.2. Banner Management
- 13.2. Worktips 13.2. Worktips
- 14.1. Period Transactions 14.1. Period Transactions
- 14.2. General Settings 14.2. General Settings
- 14.3. Import 14.3. Import
- 14.4. Utility 14.4. Utility
- 14.5. Maintenance 14.5. Maintenance
- 14.5.4. Workcube Upgrade 14.5.4. Workcube Upgrade
-
Technical Documents
- Active Directory Usage Active Directory Usage
- Communication services and CF Web Socket Communication services and CF Web Socket
- Dev, QA, Release, Live - EN Dev, QA, Release, Live - EN
- Digital Archive File Upload Digital Archive File Upload
- How should you protect your system against increasing security risks? How should you protect your system against increasing security risks?
- How to configure Security Templates? How to configure Security Templates?
- How to Use Workcube - Google Integration? How to Use Workcube - Google Integration?
- Log4j Security Vulnerability Log4j Security Vulnerability
- Release Transition and Upgrade from Master Release Transition and Upgrade from Master
- VSCode Workcube Extension VSCode Workcube Extension
- W-Error Mechanism and Error Outputs W-Error Mechanism and Error Outputs
- Workcube and Authenticator Application Workcube and Authenticator Application
- Workcube Cargo Integrations Workcube Cargo Integrations
- Workcube DB Structures Workcube DB Structures
-
Development
- 1. Development Environment – Software Languages 1. Development Environment – Software Languages
- 1.1. Workcube Software Components 1.1. Workcube Software Components
- 1.1.1. What is WO - Workcube Objects? 1.1.1. What is WO - Workcube Objects?
- 1.1.2. WEX Components 1.1.2. WEX Components
- 1.2. Workcube and Git 1.2. Workcube and Git
- 1.3. The Power of JAVA - The Convenience of Coldfusion 1.3. The Power of JAVA - The Convenience of Coldfusion
- 1.4. Contemporary Code Development Techniques 1.4. Contemporary Code Development Techniques
- 1.5. Debug Reading and Interpretation 1.5. Debug Reading and Interpretation
- 1.6. SOLR and Content Management 1.6. SOLR and Content Management
- 1.7. Customization Options 1.7. Customization Options
- 1.8. Developing Google Forms Tool with App Script 1.8. Developing Google Forms Tool with App Script
- 1.9. Voice Search and Read Aloud 1.9. Voice Search and Read Aloud
- 2. W3 Code Library 2. W3 Code Library
- 2.1. AjaxFormSubmit ve AjaxPageLoad 2.1. AjaxFormSubmit ve AjaxPageLoad
- 2.2. AjaxLoader, AjaxControlPostData and AjaxControlGetData 2.2. AjaxLoader, AjaxControlPostData and AjaxControlGetData
- 2.3. QofQ - Query of Queries 2.3. QofQ - Query of Queries
- 2.4. Autocomplete and Ready-to-Use Workdata 2.4. Autocomplete and Ready-to-Use Workdata
- 2.5. Validation and Methods 2.5. Validation and Methods
- 2.8. Filter, Map and Reduce Operations 2.8. Filter, Map and Reduce Operations
- 2.9. What is WRO and How Is It Written? 2.9. What is WRO and How Is It Written?
- 2.10. Sales Order and Reserve Transactions 2.10. Sales Order and Reserve Transactions
- 2.11. What is the Nocode Model? 2.11. What is the Nocode Model?
- 2.11.1. Nocode Usage and Flow 2.11.1. Nocode Usage and Flow
- 3. Custom Tags 3. Custom Tags
- 3.1. cf_get_workcube_note 3.1. cf_get_workcube_note
- 3.2. cf_get_workcube_asset 3.2. cf_get_workcube_asset
- 3.3. cf_barcode / Custom Tag 3.3. cf_barcode / Custom Tag
- 3.4. cf_wrk_cash / Custom Tag 3.4. cf_wrk_cash / Custom Tag
- 3.5. cf_loader 3.5. cf_loader
- 3.6. cf_box 3.6. cf_box
- 3.7. cf_workcube_websocket 3.7. cf_workcube_websocket
- 3.8. cf_box_search 3.8. cf_box_search
- 3.9. cf_workcube_process 3.9. cf_workcube_process
- 3.10. cf_workcube_general_process 3.10. cf_workcube_general_process
- 3.10. Language Customtags and Usage 3.10. Language Customtags and Usage
- 3.11. cf_duxi 3.11. cf_duxi
- 3.12. wrkIbanCode 3.12. wrkIbanCode
- 3.13. cf_language_info / Custom Tag 3.13. cf_language_info / Custom Tag
- 3.14. cf_publishing_settings 3.14. cf_publishing_settings
- 3.16. cf_puxild 3.16. cf_puxild
- 3.17. cf_send_woc 3.17. cf_send_woc
- 3.15 cf_wrkdepartmentlocation 3.15 cf_wrkdepartmentlocation
- 4. NoCode FrameWork 4. NoCode FrameWork
- 4.1. Remote Development with VSCode and Remote SSH 4.1. Remote Development with VSCode and Remote SSH
- 5.1. Live-to-Test, Test-to-Live Data Transfer 5.1. Live-to-Test, Test-to-Live Data Transfer
- 5.2. Cloud PBX(Virtual Switchboard) Integration and Usage 5.2. Cloud PBX(Virtual Switchboard) Integration and Usage
-
Case Studies
- 1. What is the Test Scenario? 1. What is the Test Scenario?
- Agriculture Case Study Agriculture Case Study
- Basic Organization Planning Study Basic Organization Planning Study
- Budget Planning Case Study Budget Planning Case Study
- Call Center - Service Transactions Case Study Call Center - Service Transactions Case Study
- Campaign Case Study Campaign Case Study
- Campaign Management Case Campaign Management Case
- Collection by Credit Card Case Study Collection by Credit Card Case Study
- CRM - Sales - Distribution Case Study CRM - Sales - Distribution Case Study
- Delay Interest Calculation Case Study Delay Interest Calculation Case Study
- Digital Transformation Case Study Digital Transformation Case Study
- E-Government Case Study E-Government Case Study
- Employee Authority Groups Case Study Employee Authority Groups Case Study
- Example Module Cases Example Module Cases
- Fabric Industry Case Study Fabric Industry Case Study
- Fashion Industry Case Study Fashion Industry Case Study
- Health Assurance System Case Study Health Assurance System Case Study
- HR Case Study HR Case Study
- Installment Sales Case Study Installment Sales Case Study
- Internal Requests Case Study Internal Requests Case Study
- Member Analysis Form Case Study Member Analysis Form Case Study
- Mixed Parcel Case Study Mixed Parcel Case Study
- Nuts Production Case Study Nuts Production Case Study
- Performance Evaluations Case Study Performance Evaluations Case Study
- Personnel Attendance Control System Case Study Personnel Attendance Control System Case Study
- Price Management Case Study Price Management Case Study
- Promotion Management Case Study Promotion Management Case Study
- Purchasing and Interwarehouse Transfer Case Study Purchasing and Interwarehouse Transfer Case Study
- Purchasing Case Study Purchasing Case Study
- Quality Control Processes Case Study Quality Control Processes Case Study
- Recruitment Case Study Recruitment Case Study
- Recruitment Case Study Recruitment Case Study
- Retail Product Collection Management Transactions Retail Product Collection Management Transactions
- Sales Order Case Study Sales Order Case Study
- Sales Process Case Study Sales Process Case Study
- Securities Case Study Securities Case Study
- Self Implementation Self Implementation
- Service and Warranty Case Service and Warranty Case
- Subscriber Management Case Study Subscriber Management Case Study
- Term Deposit Scenario Term Deposit Scenario
- Timekeeping Transactions Case Study Timekeeping Transactions Case Study
-
For Beginner
- A to Z E-Business Dictionary A to Z E-Business Dictionary
- Does my company really need an ERP? Does my company really need an ERP?
- Doing Business Above The Clouds - CLOUD COMPUTING Doing Business Above The Clouds - CLOUD COMPUTING
- How digital are your business processes? How digital are your business processes?
- How Long Do ERP Projects Take? How Long Do ERP Projects Take?
- Is my business ready for ERP? Is my business ready for ERP?
- Support and Report Problem Support and Report Problem
- What is an Application Server? What is an Application Server?
- What is ERP? What is ERP?
- What is IYS (Message Management System)? What is IYS (Message Management System)?
- Frequently Asked Questions
Chart
You can view and intervene in your production orders, the status of work centers, departments, and branch offices you want between the dates you have determined daily, weekly, monthly. With the help of the chart, you can instantly track your production and give your customers an instant deadline.
Route: ERP > Production > Production Planning > Chart
With the Charts screens, the current status of the work centers, delays, overloads, and occupancy can be monitored visually, and if desired, work orders can be easily transferred to different work centers via the visual screens by drag and drop method.
- Possibility of scheduling in accordance with branch office, department, and work center structure
- Viewing the work center's working date ranges according to the work schedule
- Tracking and planning request, production, and orders collectively or individually
- Analyzing production orders from different angles with the automatically generated chart page
- Display daily, 2-day, 3-day, weekly or monthly charts by date ranges
- Production order schedule tracking according to the created work schedules
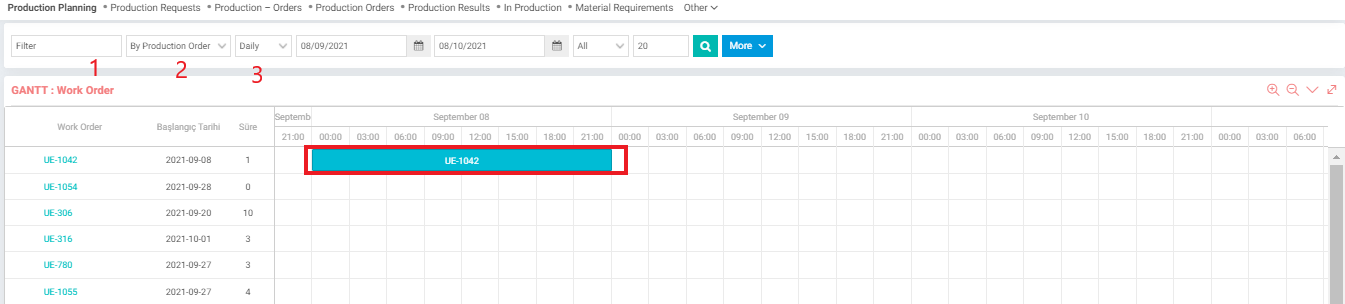
1-You can search by filtering from the filter field.
2-The chart will appear according to the option selected here. Options; It is divided into 4: By Production Order, By Order, By Product, and By Work Center.
3-From this area, the chart can be viewed daily, weekly, monthly.
Warning: Filtering options on the chart screen should be selected as branch office > department > work center > sub work center in order. It is not possible to select a department without selecting a branch office, a work center without selecting a department, and a sub work center without selecting a work center. As the selections are made, the relevant sub-unit options appear.
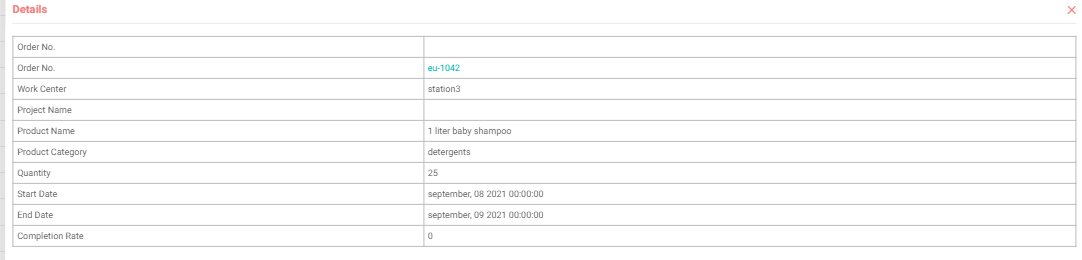
After specifying the relevant dates, when you click on the “Search” icon, a chart will appear depending on your choices. You can reach the details by touching the relevant production order in this chart;
You can connect the production order to another production order with the round icon appearing in the corners of the production orders, and you can increase or decrease the production time with the triangle icon next to them;
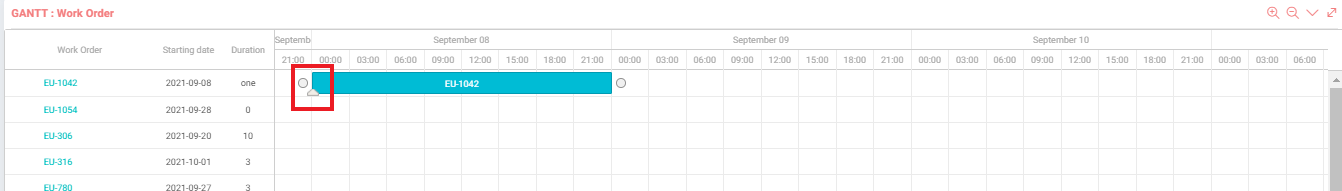
With its ease of use and flexible structure, the chart offers great convenience to production planning employees, and enables them to make changes quickly with mouse movements.